The best food tracking app in 2026: the one that wins is the one you are still using in eight weeks
In one analysis of two six-month weight loss trials, fewer than half the participants were still logging their food by week 10. So the number that decides your result is not database size or algorithm quality. It is how many seconds one meal costs you, and whether the app makes you feel bad when you go over.
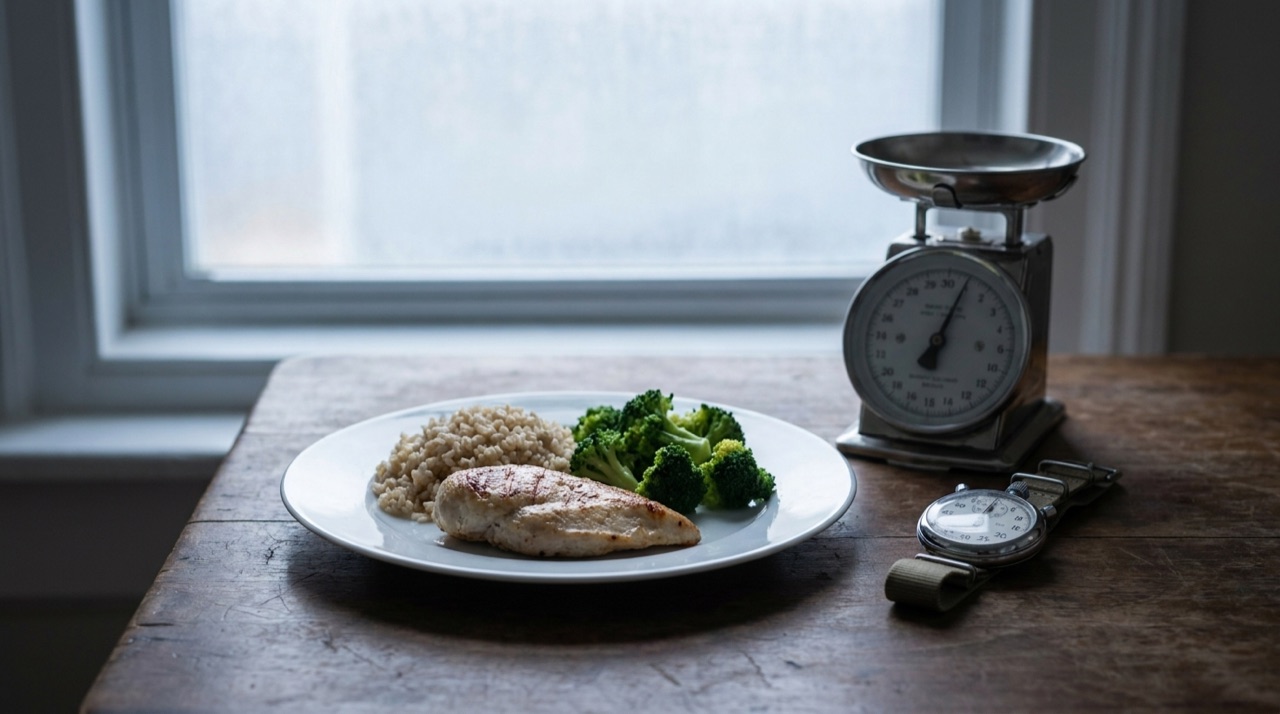
You did it properly for nine days. You weighed the rice. You looked up the oat milk, found four versions of it, picked the one with the most confirmations, and made a mental note that the porridge entry was probably wrong. On day ten you had lunch out with three other people and you were not going to sit there photographing a burrito, so you skipped it, told yourself you would add it later, and did not. Day eleven had a hole in it, which made the week look pointless, which made day twelve easy to skip too.
The reasonable assumption is that you lack discipline. The far more likely explanation is arithmetic. Tracking works, in the sense that people who self-monitor their intake tend to lose more weight than people who do not. But the benefit only accrues while you are actually doing it, and the research on real app users is blunt about how quickly that stops. Which means the entire category has been optimising for the wrong thing. Every app in this comparison advertises its food database and its algorithm. Almost none of them advertise the thing that decides your outcome, which is the cost in seconds and taps of the twenty-first time you log the same breakfast.
There is a second decider, and it is even less discussed. Feedback shaped like judgement gets switched off. If going 300 over the line turns your day red, the fastest way to make the red go away is to stop opening the app. This article is about both of those things, and then about a structural point the category has quietly avoided: your training and your food are the same problem, and almost every app in this space sells you one half of it.
Log food and train from the same app with Pocket Fit. Photograph a plate and get one entry per distinct food, with your programme and your protein target in the same place. Free on the App Store and Google Play, no card needed.
Our bias, stated first, and how we checked everything else
We make Pocket Fit. This article exists partly to sell it. Weigh everything below against that, and if that ends the conversation for you, that is a fair call to make.
What we can do is make the piece checkable. Every factual claim about MyFitnessPal, Cal AI, MacroFactor, Lose It and Noom comes from one of three places: the company's own website, its official help documentation, or its store listing, read in July 2026. Where a company does not publish something, we say so rather than filling the gap with a figure from a review site. We have not invented a feature, a limitation, a rating, a user number or a quote. Prices move constantly, differ by region, and change with whatever offer the onboarding flow shows you, so treat every number as "at the time of writing" and check the store before you pay.
Every claim about nutrition, tracking behaviour or training is tied to a named, peer-reviewed paper with a DOI at the bottom of this page. Where we are stating a design opinion rather than a finding, the sentence says so. There is a long section near the end about where the evidence runs thin, including the evidence for our own headline feature, and it is not flattering to us.
One honesty tax paid immediately. MyFitnessPal's food database is vastly larger than ours, and for a lot of people that single fact settles the decision. MacroFactor's expenditure algorithm is more sophisticated than anything we do with targets. Noom is doing something we are not attempting at all. We will say all of that again in their own sections, because a comparison that never concedes anything is an advert with footnotes.
A necessary line about scope: this is education, not dietetics
Everything here is general education about how software works and what the published research says. It is not medical, dietetic or clinical advice, and it is not personalised to you. We do not print calorie targets for readers in articles, and you should be mildly suspicious of anyone who does, because a number that is sensible for one person is not sensible for another and neither of us knows which one you are.
If you have a medical condition, are pregnant, are managing diabetes or an eating disorder, are on a GLP-1 medication, or are taking anything that affects appetite or metabolism, talk to a qualified healthcare professional or a registered dietitian about your own needs before changing how you eat. That applies with extra force to the section later on about when tracking is the wrong tool for someone, which is the part every competing "best calorie counter app" listicle leaves out.
The fast verdict: six apps, six different right answers
If you read nothing else, read this. Most people in this category buy on database size, then quit on friction.
- Choose MyFitnessPal if breadth is your binding constraint. If you eat a lot of branded, packaged, regional or restaurant food, the largest database wins on the days when nothing else can find your item, and no amount of clever design compensates for an app that cannot identify what is in front of you. It is the default for a reason.
- Choose MacroFactor if you want the most intelligent target-setting in the category and you are willing to pay for it with no free tier. Its adaptive expenditure algorithm is genuinely the strongest technical work in this comparison, and if you have ever been frustrated by a calculator that hands you a number and never revisits it, this is the app that fixes exactly that.
- Choose Cal AI if the only version of tracking you will actually do is pointing a camera at a plate, and you accept the accuracy trade that comes with it. It is the cleanest expression of the photo-first idea and it is very good at getting people who would never open a database to log something.
- Choose Lose It if you want a large database and photo logging at a gentler price point than the market leader, with a long track record and a straightforward interface.
- Choose Noom if your honest problem is not information but behaviour. If you already know what to eat and do not do it, a psychology-led curriculum with lessons and optional human coaching addresses a different bottleneck to the one a tracker addresses, and for some people that is the difference between working and not.
- Choose Pocket Fit if you want your training programme and your food in one app, with photo logging that returns one entry per distinct food rather than a single blurred meal total, targets computed from your own profile, and no second subscription. Best if you lift, and if the reason you care about protein is that you are trying to keep muscle while the weight comes off.
Note the shape of that list. Only one of those six recommendations is about food logging alone. The rest are about which specific failure mode is yours.
The number nobody puts on the box: seconds per entry
Here is the argument in one line. Tracking has a dose. The dose is days logged. Anything that raises the cost of a single entry lowers the dose, and lowering the dose lowers the result, no matter how good the database was.
The evidence for the dose is reasonable. Burke, Wang and Sevick reviewed the self-monitoring literature for the Journal of the American Dietetic Association, covering 22 studies published between 1993 and 2009, of which 15 looked specifically at dietary self-monitoring. They found a significant association between self-monitoring and weight loss consistently across the studies. They were also careful, and we will be too: the authors state plainly that the level of evidence was weak because of methodological limitations, the samples were predominantly white and female, and paper diaries dominated because most of this work predates the app era.
The evidence for the drop-off is more directly relevant and more brutal. Turner-McGrievy and colleagues, writing in the Journal of the Academy of Nutrition and Dietetics, analysed dietary self-monitoring data from two six-month mobile weight loss randomised trials with 124 adults. Their headline finding is the sentence that should be printed on the front of every app in this category: every adherence measure they examined had fewer than half the sample still tracking after week 10. Days on which someone tracked at least two eating occasions explained the most variance in six-month weight loss, with an R squared of 0.27.
Put those two findings together and the design brief writes itself. The behaviour is associated with the outcome. The behaviour collapses inside three months. Therefore the highest-leverage feature in a food tracking app is not accuracy. It is whatever keeps the twenty-first porridge entry cheap.
What one meal actually costs, path by path
This table is our estimate, not a measured study, and we are labelling it as such because we are about to be rude about unlabelled numbers elsewhere. The tap counts come from timing ourselves through the common paths on modern versions of these apps, and your device, your connection and your particular food will move them. Treat it as an order of magnitude, not a benchmark.
| Entry path | Typical taps | Realistic seconds | Fails when |
|---|---|---|---|
| Search a text database | 6 to 12 | 25 to 60 | Many near-identical entries, unclear which is right, portion still needs setting |
| Scan a barcode | 3 to 5 | 8 to 20 | No barcode, loose food, restaurant food, region not covered |
| Scan a nutrition label | 3 to 5 | 10 to 25 | Label not present or not legible, servings stated oddly |
| Photograph a plate | 2 to 4 | 8 to 20 | Mixed dishes, sauces, oil, hidden ingredients, portion depth |
| Describe it in text or speech | 3 to 6 | 15 to 30 | Ambiguous descriptions, portion words like "a bowl" |
| Log a saved meal or template | 2 to 3 | 5 to 10 | Only works once the meal exists as a template |
| Copy yesterday, or copy a previous day | 2 to 3 | 5 to 10 | Only works if you actually repeat meals |
| Weigh, then search, then adjust | 10 to 15 | 60 to 180 | Requires scales, requires you to be at home, requires patience |
Two things fall out of that table, and both of them are more important than which app has more foods in it.
First, the fastest paths are the repeat paths. Saved meals, templates and copy-day are the only entries that cost single-digit seconds, and they are the only ones whose cost falls the longer you use the app. Most people eat a startlingly repetitive diet. If the app collapses repeats into two taps, the median day gets cheap, and cheap days are the ones that survive week ten.
Second, the photograph is not competing with a weighed record. It is competing with not logging at all. That distinction decides how you should read every accuracy claim in this category, and we will come back to it with actual error figures later, including ones that are unflattering to the feature we ship.
The second question: what does the app do when you go over
Friction is half of it. The other half is what the app says on the day you eat the whole thing.
There is no clean experimental literature on interface colour and long-run app abandonment, so we are going to be explicit that this is a design position rather than a finding. But the mechanism is not exotic. If exceeding a target produces a red number, a warning, a broken streak and a "you went over" notification, then the app has made itself the bearer of bad news about your character. People do not keep a daily appointment with something that tells them off. They uninstall it, or worse, they keep it and start logging selectively, which produces a log that is both incomplete and quietly reassuring.
There is indirect support for taking the emotional design seriously. In Sacks and colleagues in the New England Journal of Medicine, 811 overweight adults were randomised to four diets with different fat, protein and carbohydrate splits and followed for two years. All groups lost about 6 kg at six months, and by two years the differences between macronutrient compositions were not significant. What did predict the result was showing up: attendance at the counselling sessions was associated with roughly 0.2 kg of weight loss per session attended. Continued engagement was the active ingredient, not the ratio.
So our position, stated as a position: a food log should read like an instrument panel, not a report card. In Pocket Fit's Fuel, that is why there are no red numbers and no shame language. You get protein, carbohydrate and fat against your targets, and a day over the line is information about tomorrow, not a verdict about you. We think that is right. We cannot show you a trial in which it beat the red-number version, because nobody has run one.
Track food without the red numbers, in Pocket Fit. Protein, carbohydrate and fat against targets built from your own profile, in the same app as your programme. Free on iOS and Android.
The six apps side by side
Everything in this table comes from each company's own website, official help documentation or store listing, read in July 2026. Where a company does not publish a figure, the cell says so rather than guessing. Prices are at the time of writing, vary by region and promotion, and change often.
| Pocket Fit | MyFitnessPal | Cal AI | MacroFactor | Lose It | Noom | |
|---|---|---|---|---|---|---|
| Database size, as the company states it | Multi-source lookup, size not published | "over 20.5 million foods" on its own blog | Nothing published | "more than 1.36 million verified food entries" | "a global food database of 56+ million items and recipes" | "over 3.7 million options" on its own blog |
| Database character | Generic-first ordering, natural-unit servings | Vast, with a published provenance taxonomy | Photo-led, database secondary | Deliberately curated, human-checked submissions | Very large, includes recipes | Colour-coded for the programme |
| Barcode scan | Yes | Yes, Premium only since 1 October 2022 per its help centre | Yes | Yes, with a named list of well-covered countries | Yes, listed under Premium | Yes, roughly 200,000 items per its blog; tier not stated |
| Nutrition label scan | Yes, separate vision path | Not named separately from Meal Scan | Yes | Yes, "a label scanner" | Not named separately | Not named |
| Photo or AI food logging | Yes, one entry per distinct food, with alternatives | Yes, "Meal Scan", Premium only | Yes, the core product, with a depth-sensor volume claim | Yes, "MacroFactor AI" in Snap and Describe modes | Yes, "Snap It", listed under Premium | Yes, "Photo Food Logging", plus the "Welli" AI assistant |
| Voice or text description | Via the AI coach | Yes, "Voice Logging", Premium only | Yes, describe your meal | Yes, speech to text and Describe | Yes, "AI Voice" under Premium | Yes, text and voice |
| Macro targets | Formula-based from your profile at programme generation | Percentages free, gram-precise goals Premium | Not stated officially | Yes, in all three programme styles | Listed under Premium | Yes, but US-only and English-only per its help centre |
| Adaptive targets | No, recomputed from profile and goal, not learned from your data | No published adaptive expenditure model | Nothing published | Yes, weekly and self-correcting, the strongest in this group | Nothing published | Programme-led rather than expenditure-led |
| Behavioural or psychological curriculum | No | No | No | No | No | Yes, "Daily lessons on psychology, habits, & behavior change" |
| Human coaching | No | No | No | No, "MF Coach" is algorithmic | Not currently verifiable | Yes, "1:1 Coach", but only "if included in your plan" |
| Workout tracking included | Yes | Exercise logging plus Premium routines, not programming | No, sold as a separate app | Separate app, separate subscription | Exercise logging and syncs | "Noom Move", 1,000+ classes |
| Programme generation for lifting | Yes, seven splits, deterministic progression | No | No | Yes, but in the separate Workouts product | No | No, classes rather than a progressed programme |
| Free tier | Yes, and food is included with membership for a limited launch period | Real but hobbled: no barcode, no Meal Scan, no gram-precise macros | Trial-led; food scanning requires a subscription | None. "there isn't (and will never be) a free version" | Basic tracking; full free list not published where we could reach it | Yes, but green-food logging only and US only |
| Price at time of writing | See pricing | Premium $79.99/yr or $19.99/mo; Premium+ $99.99/yr or $24.99/mo | Not published on its own site; store lists $0.99 to $29.99, unlabelled | $11.99/mo, $47.99/6mo, $71.99/yr; bundle with Workouts $89.99/yr | Store lists $9.99 to $79.99 plus lifetime at $49.99 and $59.99, unlabelled | Support page lists 1 month $70 up to 12 months $209 |
Read the "adaptive targets" row and the "programme generation" row together. Nobody in this table is strong in both columns. That gap is the argument in the second half of this article.
Database size claims are not comparable, and the biggest number is not the best number
Look along the first row again. Lose It publishes 56 million plus. MyFitnessPal publishes over 20.5 million. Noom publishes over 3.7 million. MacroFactor publishes 1.36 million. Cal AI publishes nothing at all. Those numbers are not measuring the same thing, and treating them as a league table is the single most common mistake people make when choosing.
The difference is inclusion policy. A very large catalogue is large because it accepts user submissions at scale, and user submissions are uneven. To MyFitnessPal's considerable credit, it publishes its provenance taxonomy openly: entries are tiered, with dietitian-verified "Best match" items, reviewed foods carrying a green tick, and unreviewed "Member submitted foods" labelled as such. That is a more honest disclosure than most of this category manages, and it explains exactly why two entries for the same yoghurt disagree.
MacroFactor goes the other way and says so. Its help centre states that submissions "are all checked for accuracy by other humans before the foods are added to the public database", and that it values "both quantity and quality, but with an emphasis on quality". It also concedes weaker restaurant coverage, which is the honest cost of that policy. Its database is roughly fifteen times smaller than MyFitnessPal's published figure, by design rather than by weakness.
Noom's blog, meanwhile, calls its database "the most reliable, comprehensive food database in the world" while publishing a figure well below two competitors. That is marketing rather than arithmetic, and the same sentence pattern appears across this whole category, ours included.
The practical rule: size predicts whether the app can find an obscure branded item. It does not predict whether the number attached to that item is right, and it actively works against you on the staples you eat every day.
MyFitnessPal: the database everyone else is measured against
Every other app in this comparison exists in a world MyFitnessPal defined, and the reason is one number.
What it genuinely does well. Its own blog states "With over 20.5 million foods, it's one of the largest food databases in the world", and its homepage invites you to "Join over 280 million people on their journey to eat better". That catalogue is the product. It is the accumulated logging of an enormous user base over more than a decade, which means the long tail is extraordinary: obscure regional products, supermarket own brands, restaurant items, the specific protein bar you bought at a petrol station in another country. The Premium page names the modern logging suite plainly: "Barcode scan and meal scan", "Voice logging and multi-day logging", "Custom macros and goals", plus fasting tracking and progress reports.
It also does something we wish more of this category did: it publishes how its own data is sourced, with dietitian-verified "Best match" entries, reviewed foods carrying a green tick, and unreviewed "Member submitted foods" labelled as unreviewed. Telling users which of your numbers you stand behind is a real act of transparency.
What MyFitnessPal does better than Pocket Fit. Breadth, and it is not close. Our lookup is generic-first and will find your chicken and your oats instantly. It will not reliably find a niche branded snack from a small regional chain. MyFitnessPal will. If your diet is heavily packaged and branded, that difference is the whole decision, and we would rather say so than have you install our app, fail to find your lunch, and conclude that food tracking does not work.
Ideal user. Someone who eats a lot of branded and out-of-home food and does not need training programming in the same place.
Where it stops. Two things, both structural rather than damning. First, the database's greatest strength is also its known weakness: an open catalogue at that scale accumulates duplicate and mis-entered items, which is why choosing between six versions of the same food is a familiar experience and why search is the slowest row in the table above. Second, the free tier. Per its own help centre, barcode scan has been Premium-only since 1 October 2022, its support pages describe Meal Scan as "a Premium only feature", and gram-precise macro goals are Premium too, with free users limited to percentages in 5% increments. That is a legitimate business decision, and it does mean the fastest common path, the barcode, is the one behind the paywall. Published pricing at the time of writing is $79.99 a year or $19.99 a month for Premium, $99.99 a year or $24.99 a month for Premium+, in US dollars, with separate regional figures published for the UK, Canada, Australia, New Zealand and Ireland.
Cal AI: the photo-first generation, and what a photo can honestly do
Cal AI is the clearest expression of an idea the whole category is now copying, and it deserves credit for the clarity rather than a sneer.
What it genuinely does well. Its App Store listing describes the flow in three steps: "1) Answer lifestyle questions to build your plan 2) Snap a photo of your meal 3) Get your nutritional breakdown", with barcode and nutrition label scanning alongside, and its own site summarises it as "Snap a photo, scan a barcode, or describe your meal". The listing shows a 4.8 star rating from 345K ratings at the time of writing.
That focus is a real achievement. There is a large population who will never open a food database, who have tried MyFitnessPal twice and abandoned it inside a fortnight, and for whom pointing a camera at a plate is the only version of this behaviour that will ever happen. Getting that person to log anything is worth more than getting a committed tracker to log slightly more precisely.
Its technical differentiator is also refreshingly concrete rather than generic AI copy. The company states that when you photograph a meal, "your phone's depth sensor calculates food volume. Our AI then analyzes and breaks down your meal". Using depth data rather than inferring portion size from a flat image is a real, falsifiable engineering claim, and portion volume is genuinely the hardest part of this problem.
What Cal AI does better than Pocket Fit. Single-purpose clarity. There is no programme to set up, no split to choose, no training context. If all you want is the photo path with nothing attached, it is a simpler product than ours and simplicity is a feature.
Ideal user. Someone whose entire relationship with tracking is a camera, who wants an estimate rather than a record, and who is honest about the difference.
Where it stops. Accuracy, and this applies to us too, so we are not scoring a point. The only accuracy figure we found published by the company itself is "90 percent accuracy on visible foods", stated on its own blog with no methodology. We are not calling that false. We are saying an unmethodologised percentage is not a measurement, that "on visible foods" is doing a great deal of work in a sentence about plates where things sit on top of other things, and that the peer-reviewed literature further down reports error bands considerably wider than 10%. The listing itself carries the sensible disclaimer that "We do not offer medical advice. Any and all recommendations should be viewed as suggestions."
On pricing we are going to do the annoying thing and refuse to give you a figure. Cal AI does not publish pricing on its own website at all. The App Store exposes in-app purchase price points from $0.99 for a "Streak Restore" up to $29.99, labelled only "Unlimited" and "Unlimited Plan", and Apple does not disclose which price maps to which billing period. The homepage promotes a 3-day free trial, and the listing carries a blanket note that food scanning analysis results require a subscription. So: trial-then-paid, headline feature gated, real price revealed after onboarding. That is all we can honestly tell you. One small oddity, reported because we promised to report what we found: the same app package is listed under different developer names on the two stores, Viral Development LLC on the App Store and Improvement Tech LLC on Google Play. We are not implying anything by it.
MacroFactor: the best algorithm in this comparison, and it is not close
We are about to say nicer things about a competitor than we say about ourselves anywhere in this article, because they are true.
What it genuinely does well. MacroFactor's central idea is that your energy expenditure is not a number a formula can hand you once. The company describes the estimate as "a deterministic calculation based on your calorie intake and changes in body weight": calories in, minus the change in stored energy, equals calories out. Its own illustration is disarmingly simple. If you eat around 2,500 Calories a day and your weight holds, you are burning around 2,500 a day. Feed it a few weeks of intake and weight data and it back-calculates what your body is actually doing, then revises your targets weekly. The company's claim is that this makes the estimate "inherently self-correcting, unlike energy expenditure estimates coming from static calculations or wearable devices", and that is a fair description of the difference.
There are three named programme styles. In Coached, the app "will take care of all program adjustments week-to-week based on your goals, your energy intake, and your changes in trend weight". In Collaborative, it handles the weekly calorie adjustment while you set daily targets. In Manual, "everything is at your discretion". That ladder of control is well judged, and fully custom macros are available to every subscriber rather than gated into a higher tier.
The database is described as "more than 1.36 million verified food entries", deliberately a curation claim rather than a size claim, with the help centre stating submissions "are all checked for accuracy by other humans before the foods are added to the public database". The company openly concedes weaker restaurant coverage, which is the honest cost of that policy. Logging includes barcode scanning with a named list of well-covered countries, a label scanner, speech to text, quick add, favourites with preferred serving sizes, and "MacroFactor AI" in Snap and Describe modes, which "allows you to capture or upload a photo of your meal, and it will automatically populate your plate with editable food entries".
Note that last phrase, because it is the same design decision we made and we are not going to pretend we are alone in it: editable per-item entries rather than one blended total.
The company also publishes an unusually detailed accuracy analysis of its own algorithm, which we describe as company-reported data rather than peer-reviewed evidence, because that is what it is. It reports typical errors 55 to 63% smaller than standard TDEE equations after three to four weeks, and a correlation of r = 0.869 between predicted and observed weight change against r = 0.595 for formulas. The same page states its own limitations: errors are reduced rather than eliminated, partial logging degrades performance substantially, and the results come from new users in their own challenge programme. Almost nobody in consumer fitness publishes a self-critical accuracy write-up with stated limitations. Doing so is the behaviour of a company that expects to be checked.
What MacroFactor does better than Pocket Fit. Target intelligence. Our targets are formula-based and recomputed from your profile. Theirs learn your expenditure from your own data and revise weekly. If a static estimate is wrong for you, that is precisely the problem MacroFactor was built to solve and we have not built an equivalent.
Ideal user. A committed, consistent logger who wants the numbers right, who will weigh in regularly, and who will pay with no free tier.
Where it stops. Three honest limits. First, the algorithm's advantage depends on you feeding it, and the company says so: partial logging degrades performance. The app that is best for a consistent tracker is not automatically best for an inconsistent one, and the people who most need help are disproportionately in the second group. Second, access: there is no free tier and the company is blunt about why, stating there "isn't (and will never be) a free version", with a 7-day trial and a card up front. Published pricing at the time of writing is $11.99 a month, $47.99 for six months or $71.99 a year in US dollars, with prices varying by local exchange rate and tax.
Third, and this matters for our argument: MacroFactor Workouts is a separate app with a separate subscription, described as a workout tracker that "builds you a training program, analyzes your performance, and tells you when to add reps or weight", with a bundle covering both at $89.99 a year. That is a good-sounding training product from a team with a strong record. It is also the clearest illustration of the structural point we make later: even the company that best understands that intake and body weight belong in one model still ships your training as a second purchase.
One clarification in fairness, because the naming invites confusion: "MF Coach" is algorithmic. The site promises "guidance one would expect from a high-quality human coach", which is an analogy rather than a claim of human staff, and the company does not say otherwise.
Lose It: the quiet, competent one with a very large database
Lose It has been around a long time and does not get discussed much, which undersells it. It is also the app we were least able to verify, and we will say that before anything else.
A verification caveat, stated up front. We could not reach loseit.com or its official help centre from our tooling, so everything here comes from the official App Store listing published by FitNow, Inc. and nothing else. That listing is company-authored and legitimate, but much thinner than a help centre, and there are things about the free tier we simply cannot enumerate. Third-party review sites publish several different database figures for Lose It. We have used none of them. Treat this as the least complete section in the article.
What it genuinely does well. The listing describes "a global food database of 56+ million items and recipes", a barcode scanner, "Photo Meal Logging - 'Snap It' lets you log meals by taking a picture", an AI Voice option where you say what you ate in a sentence, and tracking of "more than just calories including macronutrients like protein, carbs, fat, sugar". That database figure, as published by the company, is the largest in this comparison by some distance.
What Lose It does better than Pocket Fit. Catalogue breadth, for the same reason MyFitnessPal does. It also offers three distinct low-friction logging modalities in one product, barcode, photo and natural-language voice, which is a strong combination against the entry-path table. And it is the only app here with a lifetime purchase option, which is genuinely unusual in a category that has otherwise standardised on rented software.
Ideal user. Someone who wants a big database and photo logging without the market leader's subscription, and who would rather buy something once than rent it forever.
Where it stops. Like the others in this group, it is a nutrition product. No lifting programme, no progression engine, and the training relationship is a sync rather than an integration. Barcode scanning and macro tracking both sit under Premium per the listing, which matters if protein is why you are here. On price, the store lists in-app purchases at $9.99, $11.99, $19.99, $23.99, $29.99, $39.99 and $79.99, plus lifetime entries at $49.99 and $59.99, and Apple does not label which is monthly and which annual, so we will not present a headline figure we would be guessing at.
Noom: psychology first, and the people that genuinely rescues
Noom is the odd one out here, and reviewing it as a tracker is a mistake, because it is not really trying to be one.
What it genuinely does well. Its App Store listing describes the product as "Rooted in psychology. Backed by science", an "evidence-based lifestyle behavior change program" built around "Daily lessons on psychology, habits, & behavior change", alongside AI food logging, step tracking, body scans, "Noom Move: 1,000+ fitness, stretching & meditation classes", "Optional 1:1 coaching" and community "Circles". Its blog puts the database at "over 3.7 million options", with barcode coverage of nearly 200,000 items and over 850 restaurants, and its newsroom describes "Photo Food Logging" where "AI technology will automatically detect and identify the ingredients and quantities", plus an AI assistant called Welli.
One design detail deserves real credit, given the argument we made earlier about judgement. Noom's colour system is now Green, Yellow and Orange, computed from a plain calorie-density formula, framed as "Eat freely", "Eat in balance" and "Eat mindfully". There is no red. A company that removed the red from a food classification system has thought about the same problem we have and arrived somewhere similar from a completely different direction.
Here is the case for it, made properly. A tracker assumes your problem is information. For a large number of people that assumption is simply wrong. They know the biscuits are the issue. They know the portion is too big. What they do not have is a way of working on the pattern that produces the behaviour, and no amount of barcode scanning touches that. A psychology-led programme with lessons, structure and an optional human being addresses a bottleneck that pure tracking does not address at all. For some people that is the difference between another failed fortnight and something that lasts. We do not do this, we are not attempting it, and pretending it is unimportant would be dishonest.
What Noom does better than Pocket Fit. Behaviour change as an explicit curriculum, and the option of a real human coach. We have a social layer and an AI coach that can adjust your training, and neither substitutes for a person and a structured programme aimed at eating behaviour.
Ideal user. Someone whose obstacle is behavioural rather than informational, who wants lessons and accountability, and who is not primarily trying to add muscle.
Where it stops. It is not built for a lifter chasing protein and progressive overload. Noom Move offers classes rather than a progressed strength programme, and macro tracking is an optional bolt-on: its help centre states it is "only available for users in the U.S. enrolled in the English version of Noom Weight or Noom Med", which is a real constraint if you are outside the US and macros are why you are shopping.
Two further honesty notes. The human coach is not universal: Noom's support pages state plainly that "Not all programs include a 1:1 Coach", with Welli as the fallback. And the free tier, which does exist for newer accounts, is narrower than it sounds, covering green-food logging only and, again, US only.
On price, Noom is better than its reputation in one respect and confusing in another. It publishes a full ladder on a support page, from $70 for one month up to $209 for twelve months in US dollars, with the caveat that "Your final plan recommendation is personalized based on your quiz results". But the App Store in-app purchase list shows different figures, with "Noom Program" entries at $44.99, $98.99, $129.99, $159.99 and $199.99 and a "Noom Pro" at $9.99. We are reporting that discrepancy rather than reconciling it, because we cannot reconcile it from official sources, and because what you are quoted may depend on which door you came in through.
Where Pocket Fit's Fuel actually sits in that field
Now ours, at the same level of detail, with the same rule that we only claim what is true.
Fuel is the nutrition side of Pocket Fit. It handles four entry paths, tracks protein, carbohydrate and fat against targets, and does it with no red numbers and no shame. It is not the biggest database here and never will be. What we built instead is a set of decisions about the specific moments where logging gets expensive. The next few sections are those decisions, described mechanically, because specificity is the only thing that makes a phrase like "lower friction" mean anything.
The other half of the product is the training side, and it is why Fuel exists at all: programme generation from your goal, days, difficulty, equipment, split and injuries across seven splits, a deterministic progression engine, per-set calorie estimates, session duration estimates and Apple Watch support. We have written that up at length and will not re-argue it here. For depth, read how Pocket Fit builds your programme, and for the comparisons against trackers and coaching apps, the two sibling pieces: the best workout tracking app and the best AI personal trainer app.
One entry per distinct food, and why a blurred meal total is worse than it looks
This is the design decision we are most confident about, and it is easy to miss because it sounds like a detail.
Most photo food logging returns one number for the plate. You point the camera at chicken, rice and broccoli and get back a meal called something like "chicken and rice bowl" with a single calorie figure. It is fast and it feels magical.
Pocket Fit's photo analysis returns one entry per distinct food on the photo. Chicken is an entry. Rice is an entry. Broccoli is an entry. For each detected food you also get pick-another alternatives, so if it decided your turkey was chicken you fix that item rather than rejecting the whole meal.
Three consequences follow, and they compound.
You can correct a part without discarding the whole. With a single blended estimate, an error in one component leaves two bad options: accept a number you know is wrong, or delete everything and start again with the search path, which is the expensive one. That is a friction cliff, and friction cliffs are where logging dies.
Portions become adjustable where the error actually is. Estimating depth and volume from a flat image is the hardest part of the job. If the chicken looks right and the rice looks light, per-item entries let you fix the rice. A single total gives you one blunt multiplier for the whole plate.
Your protein number stops being a guess about a guess. In a deficit, protein is the number that matters most, and it is concentrated in one component of the plate. Resolving the plate into components makes that figure attributable rather than a share of an aggregate.
The limit, stated straight: per-item resolution does not fix estimation error, it localises it. The published error bars on image-based estimation are large, they apply to us, and there is a section on them below. What per-item output buys is repairability, which is a friction feature, not an accuracy feature.
Natural-unit servings, whole packages, and the tyranny of grams
An underrated way to lose a user: demand a unit they do not think in.
If you ask someone how much milk went in the coffee, they do not know it was 47 grams. They know it was a splash. If you ask how many eggs, the answer is two, not 108 grams. A gram-only interface forces a conversion at the exact moment the person is standing in a kitchen holding a pan, and every conversion is a chance to give up.
Pocket Fit gives generic foods natural-unit servings, the units people actually think in. It also supports whole-package servings with a package-size field, so "I ate the whole packet" is a single selection instead of a multiplication. Grams remain available, because people who weigh their food are the most accurate loggers in the world and we are not going to obstruct them.
This is not a clever idea. It is a boring one, and boring is the point. Decisions about units are where the seconds in the table above are won and lost.
Generic-first search, because a branded database can work against you
The counter-intuitive bit of the database argument: a bigger catalogue can make the common case slower.
Search "chicken breast" in an enormous, largely user-contributed database and results can be dominated by branded and restaurant items, because that is where entries accumulate. The person who ate plain chicken then scans a list looking for the plain one, which is exactly the scenario the table charges 25 to 60 seconds for.
Pocket Fit orders search generic-first, so common foods surface before obscure branded entries. Plain chicken, rice, oats and milk are what most people eat most days, and they should be the first result rather than the twelfth.
The honest trade: this is right for staple-heavy eating and wrong for the person whose diet is mostly branded products. That person is better served by MyFitnessPal or Lose It.
When a lookup half-fails, you should be told
Food lookup runs across multiple sources. Sources go down, time out, rate-limit and return partial results, and the tempting engineering move is to swallow the failure and show whatever came back, because an app that quietly shows a number looks healthier than one admitting a source did not answer. The result is a wrong number presented with total confidence, which is the worst possible output from a nutrition app.
In Pocket Fit, per-source lookup failures are logged rather than silently swallowed, so a lookup that half-fails is visible rather than producing a confidently wrong figure. That is a reliability practice rather than a shiny feature, and we mention it because everything else here is about trusting numbers, and you cannot audit trustworthiness from a screenshot.
Meal templates and copy-meal: most meals are repeats
Return to the entry-path table and look at where the single-digit seconds are. They are all in the repeat paths.
Most people's diets are far more repetitive than they believe. The same breakfast four or five times a week. The same two or three lunches. A rotation of maybe six dinners. If that is true of you, the marginal cost of tracking is dominated not by novel meals but by re-entering meals you have already entered.
Pocket Fit ships meal templates and copy-meal, so a repeat collapses to a couple of taps. Build the porridge once, and every subsequent porridge is a selection rather than a search.
The strategic point is the shape of the cost curve. A search-first app has a flat cost per entry: entry one and entry two hundred cost about the same. A template-first app has a falling cost per entry: expensive in week one, cheap by week four, which is precisely the period in which the Turner-McGrievy data says half the sample walks away. Designing for the falling curve aims at the exact window where tracking dies.
How Pocket Fit sets your targets, mechanically
We will describe the mechanism and deliberately not print numbers, because a calorie target published in an article is advice we are not qualified to give you.
Targets in Pocket Fit are formula-based. Calories, protein and fat are derived from tables, and carbohydrate is calculated as the remainder once the others are set. The inputs are your own profile, and targets are computed at programme-generation time, so the food side and the training side are produced from the same picture of you rather than by two unrelated onboarding flows that never compare notes.
Alongside that, the app produces a timeframe estimate derived from your current weight, your desired weight and a chosen pace. Pace comes in three settings, steady, balanced and aggressive, each carrying a different rate constant, which turns a goal into an estimated horizon rather than an open-ended intention.
Three things to say clearly.
It is an estimate, not a prediction. A timeframe from a formula tells you what the arithmetic implies if the assumptions hold. Assumptions rarely hold for a whole period, which is exactly the phenomenon MacroFactor's adaptive approach is built around, and their method addresses a real weakness of ours.
Carbohydrate as the remainder is a deliberate ordering. Protein and fat are where a floor matters, protein for the reasons the training evidence gives below and fat for basic physiological function. Carbohydrate is flexible, so it absorbs the arithmetic. That is a common approach and we are not claiming it is novel.
We are not going to tell you your number in a blog post. The app computes one from your own profile, and if your circumstances are at all unusual, a registered dietitian will do better than any formula in any app, ours included.
Weight loss timeframes are the most over-promised quantity in consumer fitness, so one note on presentation. Showing an estimated horizon is useful, because a goal without one is not a plan. Presenting it as a promise is not. The three pace settings exist to make the trade explicit rather than to imply the aggressive one is better: faster carries a larger deficit, and a larger deficit is exactly the condition under which the evidence below stops being academic.
The structural argument: your training and your food are one problem
Now the part of this comparison that is not really about food tracking at all.
Look back at the big table. Five of the six apps are nutrition products. Of the two that take training seriously, one sells it as a separate app with a separate subscription and the other is us. Meanwhile the training apps we compared in the two sibling pieces are mostly the mirror image: excellent at sets and reps, thin on food.
The category has split a single problem down the middle and sold you both halves. That split is not a conspiracy, it is just how software companies specialise. But it has a cost, and the cost lands on exactly the person this whole industry claims to serve: someone eating in a deficit who is also lifting, and who is trying not to lose the muscle they are working for.
Put your programme and your plate in one app with Pocket Fit. Your protein target comes from the same profile that generated your training week. Free on iOS and Android.
The concrete case: keeping muscle while the weight comes off
Here is the scenario where the split becomes an actual physical outcome rather than an inconvenience.
You reduce your intake. The scale starts moving. You feel like it is working, because the number everybody tracks is going in the direction everybody wants. What that number cannot tell you is the composition of what left. Weight loss is not a single substance. It is some mixture of fat and lean tissue, and the ratio is not fixed by fate. It is influenced heavily by two things: whether you are giving your body a reason to keep the muscle, and whether you are giving it the raw material to do so.
The training is the reason. The protein is the material. Neither alone does the job.
This is the difference between finishing a diet looking like a smaller version of yourself and finishing it looking like a deflated one, and it is why we have written about it from several directions: what happens to muscle in a calorie deficit, why progressive overload runs on protein, and the sharpest current version, the muscle you lose on a GLP-1 and what happens when you stop.
The GLP-1 case makes the argument unavoidable. These medications produce large, real weight loss with reduced appetite, and reduced appetite makes hitting a protein target harder at exactly the moment it matters most, while the deficit is at its steepest. That is a nutrition problem and a resistance training problem simultaneously, in the same person, in the same week. An app that only sees one of them is watching half the film.
What the protein evidence actually says
Two studies carry most of the weight here, and both are worth stating precisely rather than gesturing at.
The first is the one that isolates the mechanism. Longland and colleagues, in the American Journal of Clinical Nutrition, ran a single-blind randomised trial with 40 young overweight men, split into two groups of 20, over four weeks. Everyone ate in roughly a 40% energy deficit. Everyone did resistance training plus high-intensity interval work six days a week. The only meaningful difference was protein: 2.4 g per kg of body weight per day versus 1.2 g.
The results were not subtle. The higher-protein group gained 1.2 kg of lean mass, against 0.1 kg in the lower-protein group. They also lost more fat: 4.8 kg versus 3.5 kg. Same deficit, same training, different building material.
One honest correction to how this study usually gets quoted: the lower-protein group did not lose lean mass, they gained a trivial amount. The finding is that higher protein produced more lean mass gain and more fat loss under a severe deficit with hard training, not that 1.2 g per kg is a catastrophe. It was four weeks, in young men, under supervision, training six days a week. Read it as a mechanism demonstration, not as your prescription.
The second study tells you where the ceiling is. Morton and colleagues, in the British Journal of Sports Medicine, meta-analysed 49 randomised trials with 1,863 participants. Protein supplementation alongside resistance training produced a fat-free mass gain of 0.30 kg and a 1RM strength gain of 2.49 kg. The number everyone quotes is the breakpoint: beyond roughly 1.62 g per kg per day, they found no further gains in training-induced fat-free mass.
And now the honest part, which almost nobody includes. The 95% confidence interval on that breakpoint runs from 1.03 to 2.20 g per kg per day, which is an enormous interval. That is why practitioners often quote the top of it as a defensible ceiling rather than treating 1.62 as a precise threshold, and why anyone claiming the science has identified your exact protein requirement is saying something the paper does not. The effect also attenuates with age and is larger in people already resistance trained.
What both studies support is modest and useful: in a deficit, with resistance training, protein intake meaningfully influences what you keep. What neither supports is a specific gram target for you personally. That is between you, your body weight, and ideally a professional.
Why two subscriptions never talk to each other
So if training and protein jointly determine the outcome, why does the market keep selling them separately?
Because integration is not a feature you can bolt on. It is a data model decision made on day one.
| What lives where | Two-app setup | One-app setup |
|---|---|---|
| Your profile and goal | Entered twice, in two onboarding flows, with two different assumptions | Entered once, used by both sides |
| Your protein target | Set by the food app, which knows nothing about your training | Derived alongside the programme that creates the demand for it |
| Your training load | Known to the training app only | Sits next to the intake it depends on |
| A hard session | Invisible to the food app | Visible in the same day's view |
| A week you under-ate | Invisible to the training app | Visible where the progression decision is made |
| Cost | Two subscriptions | One membership |
| Who reconciles the two | You, manually, forever | The app |
That last row is the real one. In a two-app setup, the integration layer is a human being remembering to look at two screens and draw a conclusion. That works for about three weeks, which is roughly how long everything works.
Health platform syncs help at the margin and we are not dismissing them. But a step count crossing between apps is not the same as your protein target being computed from the same profile that decided your training split. One is data exchange. The other is a shared model.
The Body budget: four deposits, one tally
Pocket Fit's version of the shared model is the Body budget, a running tally of four deposits: your workout, your streak, your sleep and your nutrition, with nutrition, hydration and sleep assumption constants feeding into it, so it is one view rather than four widgets.
Why bother? Because the four interact and people reason about them in isolation. A bad week of sleep changes what a session costs you. A week of under-eating changes what the bar is willing to do, which is the entire argument of our progressive overload and protein piece. Presenting these as one tally is a claim that they belong in one sentence.
It is also a summary view built on stated assumptions, not a physiological measurement, and it has not been validated against anything because there is nothing obvious to validate it against. It is a design choice about attention, and it is fair to call it unproven.
And the commercial point, stated as the limited thing it is: food is currently included with the workout membership for a limited launch period, rather than being a second subscription. That is a launch arrangement rather than a permanent promise, and we would rather write that honestly than imply a guarantee we might not keep. Check pricing for what is true on the day you read this.
How wrong is self-reported intake? Wrong enough to change how you read your own log
Here is where we undermine our own product category, because the alternative is letting you believe something false.
The foundational study is Lichtman and colleagues in the New England Journal of Medicine, one of the most quietly devastating papers in nutrition. They screened 224 obese subjects and studied 10 who described themselves as diet-resistant, measuring actual energy expenditure with doubly labelled water rather than trusting a diary. The finding: these subjects underreported their actual food intake by 47%, plus or minus 16%, and overreported their physical activity by 51%. Their measured metabolic rates were within 5% of predicted, ruling out the slow metabolism explanation they had assumed.
This was not lying. That is the important part. These were motivated people sincerely reporting what they believed they had eaten.
The effect generalises well beyond that small sample. Freedman and colleagues, in the American Journal of Epidemiology, pooled five large US validation studies using recovery biomarkers as the reference. Average underreporting of energy intake was 28% with a food frequency questionnaire and 15% with a single 24-hour recall, with poor correlations between reported and true intake: r = 0.21, 0.26 and 0.31 respectively. Underreporting was strongly predicted by BMI and, contrary to how this literature often gets summarised, results were similar across sexes. For sex-specific numbers you want Subar and colleagues and the OPEN study, with 484 adults, where men underreported energy by 12 to 14% on recalls and women by 16 to 20%.
Sit with what that means for your own app. Every number in every food log in this comparison is downstream of a human being estimating what they ate. The database can be perfect and the total still materially wrong, because the error entered before the database was consulted. Anyone selling you accuracy here, us included, is selling the accuracy of one link in a chain whose weakest link is a person remembering a portion.
The correct response is not despair, and definitely not to stop logging. It is to change what you use the log for. A food log is a good instrument for consistency, for relative change, and for whether the protein went in. It is a poor instrument for absolute truth. Read your trend, not your total.
How accurate are photo calorie counters, honestly
We ship a photo food scanner. Here is the published evidence on how well that class of technology works, including the parts that are bad for us.
Shonkoff and colleagues published a systematic review in Annals of Medicine covering 52 peer-reviewed papers on AI-based digital image dietary assessment from 2010 to 2023. The average relative error for calories across studies ranged from 0.10% to 38.3%, with individual estimates spanning 0.00% to 79.6%. The authors could not perform a meta-analysis because the studies were too heterogeneous in how they defined ground truth. Only 8 of the 52 papers included human assessors, only one compared AI directly against humans, and no study used bomb calorimetry. That range is best read as "wildly variable and not comparable across studies", which is a finding about the state of the literature as much as about the technology.
More directly relevant is Fridolfsson and colleagues, in Current Developments in Nutrition, who evaluated three large language models against weighed reference values on 52 standardised food photographs. The mean absolute percentage error for energy was 35.8% for two of the models and 64.2% for the third. Macronutrients were worse than calories, with protein errors of 60.7%, 61.7% and 109.9%.
Two details deserve flagging rather than burying. First, all three models underestimated more as portion size grew, a systematic bias in the least helpful possible direction: the bigger the meal, the more it flatters you. Second, a single misidentification produced extreme errors, including one carbohydrate overestimate of 1,788%. The authors conclude that this class of tool may be useful as a low-burden screening method but is "not yet suitable for precise dietary assessment in clinical or athletic populations".
We are not going to dress that up. The honest reading is that photo estimation currently lands in roughly the same 30 to 40% error band as self-reported dietary recall. It does not solve the accuracy problem. It substitutes convenience for precision.
So why do we ship it? Because of the two facts in the first half of this article. The alternative to a photo is very often not a weighed record, it is nothing at all, on the day you were out with three other people. Given that fewer than half of trial participants were still logging by week 10, and that days logged is what tracks with the outcome, a method with 35% error used on 200 days beats a method with 10% error used on 30. That is an adherence argument, not an accuracy argument, and anyone in this category making an accuracy argument for photo logging is ahead of the evidence.
It is also why our photo path returns one entry per distinct food with alternatives. Since misidentification is the source of the extreme errors in the Fridolfsson data, being able to fix one wrong item is worth more than a slightly better first guess.
Why adherence beats precision, and what that means for which app you pick
Pull the threads together and you get a conclusion that reorders the whole buying decision.
Johnston and colleagues published a network meta-analysis in JAMA covering 48 randomised trials and 7,286 overweight and obese adults. At six months, low-carbohydrate diets produced 8.73 kg of weight loss and low-fat 7.99 kg. At twelve months, 7.25 kg and 7.27 kg. The gap closes to nothing. Differences between named diet programmes were small, and the authors' conclusion supports recommending any diet a patient will adhere to. Notably, adding behavioural support was worth 3.23 kg at six months, larger than most of the differences between the diets themselves. Sacks and colleagues found the same over two years with 811 adults and four macronutrient compositions: no significant advantage to any of them, and weight loss associated with session attendance.
Now transpose that from diets to apps, which is a step the literature does not take and we are taking deliberately, so treat it as our inference rather than a finding. If differences between diets are small compared to the difference adherence makes, the same is likely true of food tracking apps. The database, the algorithm and the interface are the equivalent of the macronutrient split. What decides your outcome is whether you are still doing it in three months.
Which reframes the buying question. Stop asking which app is best. Ask which app you will still be opening in November.
When tracking is the wrong tool, and how to tell
This section is the reason we think this article is worth reading, and it is the section every "best calorie counter app" listicle omits, because it is bad for conversions.
For some people, food tracking is not a neutral instrument. It is an accelerant.
Levinson, Fewell and Brosof surveyed 105 individuals diagnosed with an eating disorder, recruited after discharge from residential or partial hospitalisation treatment, and published the results in Eating Behaviors. Of those, 78, or 74.3%, had used MyFitnessPal to track calories. Among those users, 73.1% reported that it at least somewhat contributed to their eating disorder, and 62.9% said at least moderately. Reported use correlated with eating disorder symptom subscales: shape concern at r = 0.34, weight concern at r = 0.36, restraint at r = 0.25.
We have to state the limits of that study clearly, because overstating it would be its own kind of harm. It is cross-sectional and correlational. It is a clinical sample reporting retrospective perceptions of what contributed to their illness. It cannot tell you whether tracking causes disordered eating or whether people already vulnerable to disordered eating are drawn to tracking, and the correlations are small to moderate. It is emphatically not evidence that calorie tracking causes eating disorders in the general population, and it names one app only because that app is the one most people use.
What it does establish is that the risk is real enough to design for and real enough to talk about. So here is the honest guidance, offered as general education and not as clinical assessment.
Signs that tracking may be the wrong tool for you right now:
- Logging makes you anxious rather than informed, and you think about the number when you are not using the app.
- You find yourself choosing foods because they are easy to log rather than because you want them.
- Going over the target ruins the day emotionally, or triggers restriction the following day to compensate.
- You have stopped eating in social situations because they are hard to track.
- You have a history of an eating disorder, or you are in recovery from one.
- The precision is escalating: grams where you used to use portions, then weighing things you never used to weigh.
If several of those are true, the right move is not a different app. It is to stop tracking and speak to a qualified professional, a GP or a registered dietitian, or a specialist eating disorder service. That advice costs us a customer and it is still the correct advice. Progressive overload, protein and body composition will all still be there afterwards, and there are ways to train and eat well that involve no logging whatsoever.
For people without that vulnerability, tracking is a tool like any other, and the design choices we have argued for throughout, no red numbers, no shame language, a log that reads as an instrument panel, are partly aimed at not tipping a neutral tool into a punitive one. We do not claim that our design prevents anything. We claim that we thought about it.
Where our evidence and our product run thin
The section we would delete if this were only an advert.
We have no adaptive expenditure model. MacroFactor's approach addresses a real weakness of formula-based targets. A formula computed from your profile assumes things that may be wrong and does not learn otherwise from your data. That is a fair criticism and we will not argue with it.
Our photo path carries the same error bars as everyone else's. Nothing in the per-item design fixes estimation accuracy. It improves repairability. Different claims, kept separate throughout.
Our database is far smaller than the leaders'. If you cannot find your food, none of our other design work matters.
The seconds-per-entry table is our estimate. We timed ourselves. It is not a study, nobody has run the study, and we would like someone to.
The no-red-numbers design is unproven. There is no trial showing a non-judgemental food log produces better long-run adherence than a judgemental one. We believe it, we cannot show it, and the honest label is "reasoned design position". The same goes for the Body budget, which is a summary view resting on stated assumptions, not a measurement.
The strongest evidence here is not about apps. Burke's review is described by its own authors as weak evidence with methodological limitations, drawn largely from paper diaries in a pre-app era, in samples predominantly white and female. The protein work is strong but short-term and mostly in young men. The image-assessment literature has no risk-of-bias tool and could not be meta-analysed. Everyone in this category, including us, is extrapolating from adjacent evidence.
And we make the product. Every design choice defended above was made by people with a commercial interest in defending it.
What Pocket Fit does worse than these apps
Explicitly, in one list.
- Database breadth. MyFitnessPal and Lose It publish figures that dwarf anything we have. For branded, restaurant and regional food, they will find items we will not, and that is decisive for a lot of people.
- Target intelligence. MacroFactor's self-correcting expenditure model is the most sophisticated work in this comparison and we have no equivalent.
- Data provenance disclosure. MyFitnessPal publishes a tiered verification taxonomy for its entries. We do not publish anything comparable.
- Behavioural curriculum and human coaching. Noom offers structured psychology lessons and, on some plans, a human coach. We offer neither.
- Single-purpose simplicity. If you want only a camera and a number, Cal AI is a simpler product than ours, and simpler is genuinely better for some people.
- Lifetime pricing. Lose It offers a one-off purchase option. We do not.
Free tiers, and what "free" actually means in this category right now
The word is doing five different jobs across this table, and it is worth separating them because "free" is the most misleading term in app marketing.
| App | What "free" actually means at the time of writing |
|---|---|
| MacroFactor | Nothing. The company states there "isn't (and will never be) a free version". 7-day trial with a card up front |
| Cal AI | Free download, 3-day trial promoted, and the core food scanning feature requires a subscription |
| MyFitnessPal | A real, usable free tier, but with barcode scan, Meal Scan, voice logging and gram-precise macros all behind Premium |
| Lose It | Basic tracking is free; we could not reach the company's official free-versus-premium page to enumerate it properly |
| Noom | A free tier exists for newer accounts, but food logging on it covers green foods only, and it is US only |
| Pocket Fit | Free to start with no card, and food is included with the workout membership for a limited launch period |
We would rather you read that table than our marketing. Note in particular that the two fastest entry paths in the whole category, barcode and photo, are behind a paywall in four of the six.
How to choose in five minutes
- Is your food mostly branded and packaged, or mostly staples you cook? Branded points hard at MyFitnessPal or Lose It. Staples make a smaller generic-first database perfectly sufficient.
- Is your real problem information, or behaviour? If you already know what to do and do not do it, a tracker is the wrong purchase. Look at Noom, or at human support of some kind.
- Will you log consistently, honestly? If yes, MacroFactor's adaptive targets will reward that consistency more than anything else here. If no, prioritise the cheapest entry paths and the strongest repeat-meal features, because a clever algorithm fed partial data is not clever.
- Do you lift, and do you care about keeping muscle? Then your protein target and your training programme are one decision, and the two-app setup is a tax you pay in reconciliation. This is where we think we are the right answer, and we have shown our working above.
- Then run the eight-week test. Whatever you install, log your most repeated meal, then log it again the next day. If the second time was not dramatically faster than the first, the app has no repeat path worth having, and week ten is going to be a problem.
Put it together: one problem, one app, and the seconds that decide it
Two questions decide whether a food tracking app changes your body, and neither of them appears on the App Store screenshots.
The first is how much one meal costs you. Not how many foods are in the database, but how many taps and seconds the twenty-first porridge takes. That is why Fuel is built the way it is: a photo path that returns one entry per distinct food with alternatives when it guesses wrong, a separate vision path for nutrition labels, natural-unit servings and whole-package support so you never have to convert a splash of milk into grams, generic-first search so staples surface first, meal templates and copy-meal so repeats collapse to a couple of taps, and per-source lookup failures that are logged rather than quietly hidden behind a confident wrong number. Protein, carbohydrate and fat against targets built from your own profile. No red numbers and no shame.
The second is whether your food and your training are the same conversation. In Pocket Fit they are: targets are computed at programme-generation time from the same profile that produced your split, your days, your equipment and your injuries; the Body budget keeps workout, streak, sleep and nutrition in one running tally; the scheduler reshuffles a missed session into the rest of the week rather than deleting it; the AI coach rebuilds a session from a sentence; and the programme updates week to week from what you log. For a limited launch period, that includes food rather than charging you a second time for it.
None of that is because a growth deck asked for a nutrition tab. Pocket Fit's founder went from 122 kg to competing at The Yard Games, having lost 38 kg along the way, and the reason food and training live in one app is that separating them is exactly what fails during the bad weeks. The longer version is on our story.
And the honest closing note, repeated because it matters more than the sale: if tracking makes you anxious rather than informed, the correct move is to stop and talk to a professional. Nothing in this article is medical or dietetic advice, and the best food tracking app for a person who should not be tracking is no app at all.
Start with Pocket Fit, free. Photograph a plate, get one entry per food, and see it next to the programme it is meant to fuel. Personalised in minutes on iOS and Android.
Best food tracking app: common questions
What is the best free food tracking app?
It depends what you need free. MyFitnessPal has the most usable genuinely free tier of the big names, but barcode scanning has been Premium-only since 1 October 2022 per its own help centre, so the fastest path is paid. Noom's free tier covers green-food logging only and is US only. MacroFactor states outright that it will never have a free version. Pocket Fit is free to start with no card, and food is currently included with the workout membership for a limited launch period. Check current terms in the store before deciding, because every one of these has changed in the last few years.
Do AI photo calorie counters actually work?
They work in the sense that they get people to log who otherwise would not. They do not work as precision instruments, and we ship one. A systematic review in Annals of Medicine covering 52 papers found calorie errors ranging from 0.10% to 38.3% across studies, too heterogeneous to pool. A validation study in Current Developments in Nutrition against weighed references found mean absolute percentage errors for energy of 35.8% to 64.2%, with protein errors from 60.7% to 109.9%, and a systematic tendency to underestimate larger portions. Use a photo as an estimate that gets logged, not as a measurement. Its value is that it costs about 10 seconds instead of 60.
Is MyFitnessPal still worth it?
For a lot of people, yes, and the reason is the database. Its own blog states over 20.5 million foods, and it publishes a provenance taxonomy telling you which entries are dietitian-verified and which are unreviewed member submissions, which is more transparency than most of this category offers. The caveat is that the free tier is deliberately narrower than it used to be, with barcode scan, Meal Scan, voice logging and gram-precise macros all Premium. If you eat a lot of branded and out-of-home food, its breadth is still the strongest argument in the category.
How accurate is calorie tracking?
Less accurate than almost everyone assumes, and the error is mostly human rather than technological. Lichtman and colleagues in the New England Journal of Medicine found that motivated subjects underreported their intake by 47% while overreporting activity by 51%. Freedman and colleagues pooled five biomarker validation studies and found average underreporting of 28% with a food frequency questionnaire and 15% with a single 24-hour recall. The practical implication is to treat your log as a consistency instrument and a trend line, not as a precise ledger. Compare this week to last week rather than trusting the absolute total.
Do I need to track macros to build muscle?
No, but protein is the one that repays attention, especially in a deficit. Longland and colleagues found that with resistance training under a 40% deficit, 2.4 g/kg/day produced 1.2 kg of lean mass gain versus 0.1 kg at 1.2 g/kg/day, with more fat loss too. Morton and colleagues, across 49 trials and 1,863 participants, found no further training-induced fat-free mass gains beyond about 1.62 g/kg/day, though with a wide confidence interval of 1.03 to 2.20. Plenty of people build muscle without tracking anything. Tracking mainly helps when your intake is restricted and protein is the thing most likely to get squeezed. Speak to a dietitian about what suits you specifically.
MacroFactor vs MyFitnessPal: which is better?
They are optimised for different things and both are honest about it. MyFitnessPal is breadth: over 20.5 million foods with published provenance tiers, so it can find nearly anything. MacroFactor is precision of targets: a self-correcting expenditure model that derives your maintenance from your own intake and weight data rather than from a formula or a wearable, updated weekly, with a curated database of about 1.36 million human-checked entries. Choose MyFitnessPal if finding obscure items is your constraint. Choose MacroFactor if your targets being right is your constraint, and if you will log consistently, since the company notes partial logging degrades the algorithm.
Can one app do both workouts and food?
Yes, and very few do it in one subscription. Most of this category sells nutrition or training, and the closest competitor here, MacroFactor, sells its Workouts product as a separate app with a separate price and a bundle. Pocket Fit generates your programme from your goal, days, equipment, split and injuries, progresses it on a deterministic rule, and computes your nutrition targets from the same profile at the same time. The argument for one app is not convenience, it is that keeping muscle in a deficit depends on training and protein jointly, so splitting them across two products leaves the reconciliation to you.
Is calorie tracking bad for you?
For most people it is a neutral tool. For some it is not. A survey of 105 people with diagnosed eating disorders in Eating Behaviors found 74.3% had used a calorie tracking app, and among those, 73.1% felt it at least somewhat contributed to their disorder. That study is correlational and cannot establish cause, and it is not evidence about the general population. But if logging makes you anxious, if going over the target triggers restriction the next day, if you avoid social meals because they are hard to track, or if you have a history of disordered eating, stop and speak to a GP, a registered dietitian or a specialist service. This is general education, not medical advice, and no app is worth that trade.
Does food tracking actually help you lose weight?
The association is consistent, but the evidence is weaker than the industry implies. Burke, Wang and Sevick reviewed 22 studies and found a consistent association between self-monitoring and weight loss, while stating explicitly that the level of evidence was weak because of methodological limitations. The more useful finding is about dose: Turner-McGrievy and colleagues found that across two six-month trials, fewer than half the sample was still tracking after week 10, and that days tracking at least two eating occasions explained the most variance in six-month weight loss. Tracking appears to help while you do it, which is why the friction of a single entry matters more than the sophistication of the app.
What should I look for in a food tracking app for building muscle?
Three things. A protein target you can actually see against, since that is the macro that decides what you keep in a deficit. A fast repeat path, because muscle-building diets are repetitive by nature and re-entering the same chicken and rice every day is where tracking dies. And ideally a connection to your training, because the protein number only means something in the context of a progressive stimulus. We wrote about that relationship in progressive overload runs on protein, and about the shortcut version of the question in there is no shortcut that skips the training.
References
- Lichtman SW, Pisarska K, Berman ER, Pestone M, Dowling H, Offenbacher E, Weisel H, Heshka S, Matthews DE, Heymsfield SB (1992). Discrepancy between self-reported and actual caloric intake and exercise in obese subjects. New England Journal of Medicine, 327(27), 1893-1898. DOI: 10.1056/NEJM199212313272701
- Freedman LS, Commins JM, Moler JE, Arab L, Baer DJ, Kipnis V, Midthune D, Moshfegh AJ, Neuhouser ML, Prentice RL, Schatzkin A, Spiegelman D, Subar AF, Tinker LF, Willett W (2014). Pooled results from 5 validation studies of dietary self-report instruments using recovery biomarkers for energy and protein intake. American Journal of Epidemiology, 180(2), 172-188. DOI: 10.1093/aje/kwu116
- Subar AF, Kipnis V, Troiano RP, Midthune D, Schoeller DA, Bingham S, Sharbaugh CO, Trabulsi J, Runswick S, Ballard-Barbash R, Sunshine J, Schatzkin A (2003). Using intake biomarkers to evaluate the extent of dietary misreporting in a large sample of adults: the OPEN study. American Journal of Epidemiology, 158(1), 1-13. DOI: 10.1093/aje/kwg092
- Burke LE, Wang J, Sevick MA (2011). Self-monitoring in weight loss: a systematic review of the literature. Journal of the American Dietetic Association, 111(1), 92-102. DOI: 10.1016/j.jada.2010.10.008
- Turner-McGrievy GM, Dunn CG, Wilcox S, Boutté AK, Hutto B, Hoover A, Muth E (2019). Defining adherence to mobile dietary self-monitoring and assessing tracking over time. Journal of the Academy of Nutrition and Dietetics, 119(9), 1516-1524. DOI: 10.1016/j.jand.2019.03.012
- Longland TM, Oikawa SY, Mitchell CJ, Devries MC, Phillips SM (2016). Higher compared with lower dietary protein during an energy deficit combined with intense exercise promotes greater lean mass gain and fat mass loss: a randomized trial. The American Journal of Clinical Nutrition, 103(3), 738-746. DOI: 10.3945/ajcn.115.119339
- Morton RW, Murphy KT, McKellar SR, Schoenfeld BJ, Henselmans M, Helms E, Aragon AA, Devries MC, Banfield L, Krieger JW, Phillips SM (2018). A systematic review, meta-analysis and meta-regression of the effect of protein supplementation on resistance training-induced gains in muscle mass and strength in healthy adults. British Journal of Sports Medicine, 52(6), 376-384. DOI: 10.1136/bjsports-2017-097608
- Johnston BC, Kanters S, Bandayrel K, Wu P, Naji F, Siemieniuk RA, Ball GDC, Busse JW, Thorlund K, Guyatt G, Jansen JP, Mills EJ (2014). Comparison of weight loss among named diet programs in overweight and obese adults: a meta-analysis. JAMA, 312(9), 923-933. DOI: 10.1001/jama.2014.10397
- Sacks FM, Bray GA, Carey VJ, Smith SR, Ryan DH, Anton SD, McManus K, Champagne CM, Bishop LM, Laranjo N, Leboff MS, Rood JC, de Jonge L, Greenway FL, Loria CM, Obarzanek E, Williamson DA (2009). Comparison of weight-loss diets with different compositions of fat, protein, and carbohydrates. New England Journal of Medicine, 360(9), 859-873. DOI: 10.1056/NEJMoa0804748
- Shonkoff E, Cara KC, Pei X, Chung M, Kamath S, Panetta K, Hennessy E (2023). AI-based digital image dietary assessment methods compared to humans and ground truth: a systematic review. Annals of Medicine, 55(2), 2273497. DOI: 10.1080/07853890.2023.2273497
- Fridolfsson J, Sjöberg E, Thiwång M, Pettersson S (2025). Performance evaluation of 3 large language models for nutritional content estimation from food images. Current Developments in Nutrition, 9(10), 107556. DOI: 10.1016/j.cdnut.2025.107556
- Levinson CA, Fewell L, Brosof LC (2017). My Fitness Pal calorie tracker usage in the eating disorders. Eating Behaviors, 27, 14-16. DOI: 10.1016/j.eatbeh.2017.08.003
- MyFitnessPal official website, its Premium pricing page, its official blog and its official help centre, myfitnesspal.com, accessed July 2026.
- Cal AI official website and its App Store and Google Play listings, calai.app, accessed July 2026.
- MacroFactor official website, its pricing page, press kit and official help centre, macrofactor.com, accessed July 2026.
- Lose It official App Store listing, published by FitNow, Inc., accessed July 2026. The company's own website and help centre were not reachable from our tooling.
- Noom official website, its official blog, support centre and App Store listing, noom.com, accessed July 2026.
Pocket Fit is a fitness and wellbeing app, not a medical device. It does not diagnose, treat or prevent any condition. Always consult a qualified healthcare professional before starting or changing a training or nutrition programme, and if you have persistent problems with sleep, pain or fatigue.
Georgi, founder of Pocket Fit. He went from 122 kg to competing at The Yard Games, having lost 38 kg along the way.
Train smarter with Pocket Fit
Download the app